How To Get The Most Out Of The Updated Attribution Report
Google Ads has a section that can help with measuring the click journey before a conversion occurred in your PPC account. This report has previously been called Search Attribution, but Google has revamped it and changed the name to Attribution. To get to the Attribution page within Google Ads click on ‘Tools & Settings’ on the top right of the page and then on ‘Attribution’ which can be found under the ‘Measurement’ heading.
The problems with using the last-click attribution model have been discussed many times across several PPC blogs. In 2020, advertisers really should be looking at using an attribution model that shares the credit to all of the touchpoints that were involved in a conversion. However, all business niches are different, which means there isn’t a one size fits all attribution model that is right for all businesses. We have a blog explaining more about the importance of moving away from a last-click attribution model as well as explaining your PPC attribution model options in more detail.
Advertisers need to take steps to understand the typical conversion journey that their customers go through, and then to utilise the attribution model that is most appropriate for their business. This is where the Attribution report within Google Ads can help PPC advertisers.
What is the Attribution report?
The attribution report within Google Ads can give an idea on the paths that people take, before converting on the advertiser’s website.
The Attribution report has been designed to be simpler than the previous Search Attribution report, while still showcasing all the relevant data to the advertiser.
The Attribution section of Google Ads contains five reports. These are below. In this blog, we will explore what each report looks at, and PPC marketers can benefit from each section of the report.
- Overview
- Top paths
- Path metrics
- Assisted conversions
- Model comparison
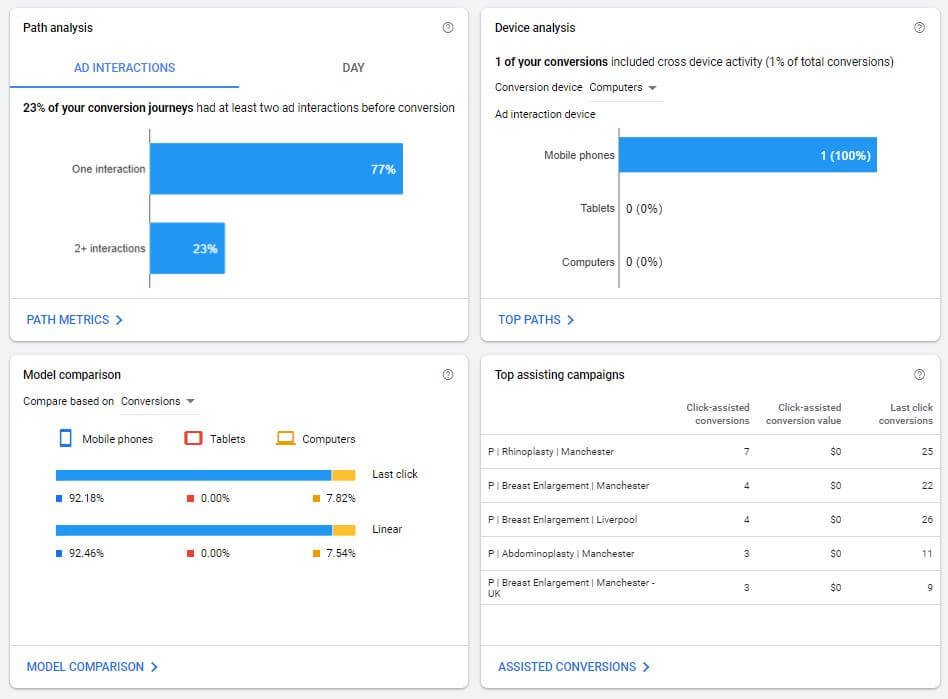
The Overview section
As you can guess, the overview section of the Attribution page gives an overview of all the reports that are available to PPC advertisers.
You can see a top-level view of the path length before a conversion occurred, the devices that aided in a conversion, the difference in conversions by device when comparing last-click attribution with one other attribution model and the top campaigns that assisted in a conversion.
Top Paths report
The Top Paths report shows the path that was taken before a conversion occurred.
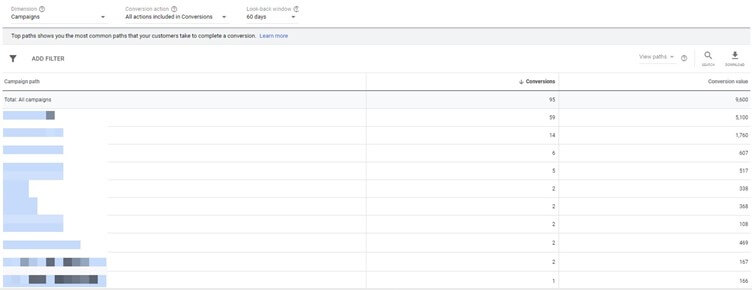
You can look at the campaign, ad group, keyword or device path in a conversion. To do this, click on the Dimension dropdown. You can also change conversions actions that you look at and the lookback window.

You can use the Top Paths report to get an idea on which campaigns tend to aid the conversion funnel and which ones tend to be the ones that complete the conversion. You can do this for a keyword or ad group as well.
You could also have a look to see if there is a device that is often in the early stages in a conversion. For example, it is argued that mobiles are used as a research device which leads to a conversion on a different device. By splitting the data by device in the Top Paths report, you can get an idea as to whether that applies in your niche.
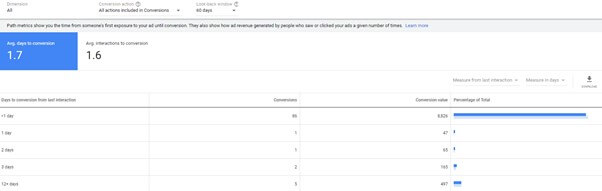
Paths Metrics
The Path Metrics report shows the number of days it took after the user first saw your ad before they converted.
This report is useful to get an idea of how long the research phase is in your niche. If your research phase is quite long, then this may be an indication that you need an attribution model that doesn’t weigh as much of the credit to the last click. If your research journey is quite short, then you may want to choose an attribution model that gives more weight to the last click, such as the time decay attribution model.
Also, once you have an idea on the number of days that it typically takes to get conversions, you can project your conversions better. For example, if you know that most of your conversions appear two days after the user is first exposed to your ad, then you can start to project what how many conversions you can expect from yesterday’s advertising spend.
Assisted Conversions
The Assisted Conversions report displays the number of last click and non-last click conversions that were obtained by each campaign, ad group, keyword or device.One of the useful features about this report is that it shows the ratio of assisted click conversions compared to last-click conversions. This will give you a better idea on how best to calculate the value of a campaign, ad group, keyword or device.
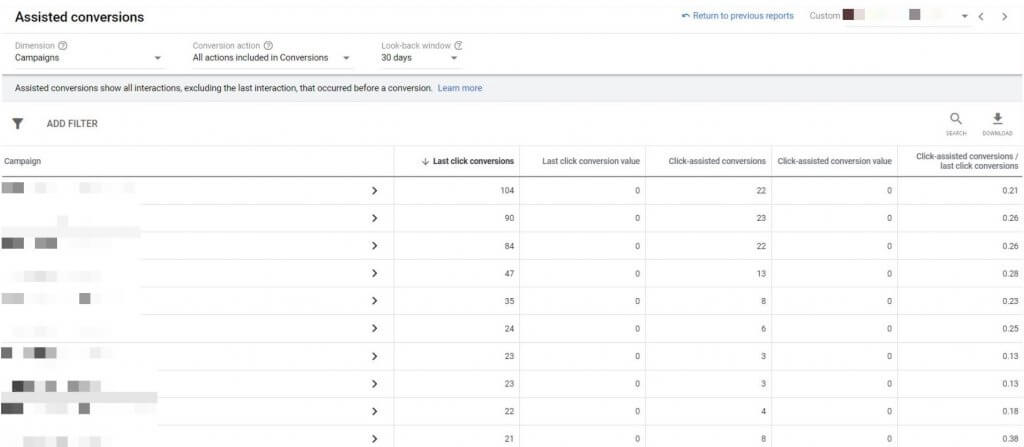
Just like in other parts of the Search Attribution section, you can further segment the data by Dimension, conversion action and lookback window.
Model Comparison
The model comparison report is very useful when it comes to deciding on which attribution model to use if you’re thinking of moving away from the last-click attribution model. It allows you to compare the difference in how your conversions would get allocated in your account if you were to switch from one attribution model to a different one.
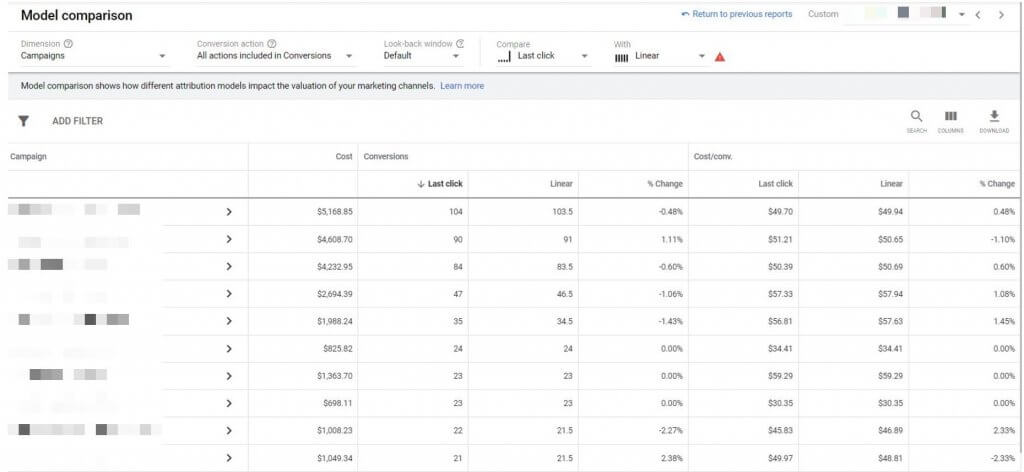
For example, if any campaigns could report a reduction in conversions after you change attribution models, then you know to look out for this when looking at PPC performance reports.
Wrapping up
Google has continually highlighted the importance of moving away from the last-click attribution model to PPC marketers. The updated Attribution report within Google Ads makes it even easier for Google Ads advertisers to start analysing their customer’s conversion journey and how changing to a different attribution model would affect their PPC advertising. If you’re looking for an expert PPC agency to help you to choose the best attribution model for your business, then get in touch with us today.