5 Google Analytics reports for PPC
As PPC experts, we tend to stick to using the data and reporting capabilities provided by Google Ads, Facebook or whatever PPC advertising platform that we’re advertising on.
Google Ads has a lot of data within it to help advertisers create a PPC strategy and generally improve their PPC marketing performance.
As a PPC marketing company, we’re deep diving into Google Analytics almost every day. Some reports in Google Analytics are not in Google Ads. These reports can help you to improve your PPC marketing performance if you know how to use them.
In this blog, I will discuss five reports within Google Analytics that PPC marketers can use to improve their PPC performance.
The reports that I’ll be talking about are affinity categories, in-market segments, time lag and path length reports, source/medium report, assisted conversions report and location report.
1. Affinity categories and In-market Segments
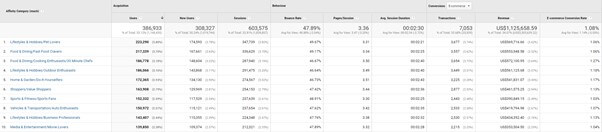
The Affinity Categories and In-Market Segments reports give you an idea on the kind of persona that the people visiting your site fall into.
Google looks at the browsing history of a user as well as other data points that it has on the user to put them into one of the affinity categories and In-Market segments that it has. It can then report on how people in each audience group interacted with your site within Google Analytics.
The Affinity Categories report shows you how people interacted with your website based on their interests. So, for example, it can show you if the people who are most likely to convert on your site are interested in online videos, dogs, or sports news.
The In-Market Segments report shows you what things the people who visited your site appear to be in the market for right now using Google’s browsing history and other data.
Seeing as though Google owns both Google Ads and Google Analytics, the audience lists within the two platforms are the same. This means that if you find an audience list that you want to target in Google Ads, you can use the exact same audience and don’t have to find something similar in Google Ads.
You can get audience performance data within Google Ads, but you first need to run PPC campaigns and start building up your data.
If you haven’t started running PPC campaigns just yet, then you can use the data within Google Analytics.
Another thing to consider is that Google Analytics contains audience data from all your website visitors. Whereas Google Ads only contains Google Ads audience data. This means that Google Analytics is likely to build up audience data faster.
Where to find the report
To find the report, go to Audience > Interests > Affinity Categories or In-Market Segments.
Columns in the report
The columns in the report will show the following:
- Users
- New users
- Sessions
- Bounce Rate
- Pages/Session
- session duration
- Transactions
- Revenue
- E-commerce
- Conversion rate
How to use the reports
Using the reports may seem a bit of a daunting task at first, but there are ways to separate the data and make it easier.
Here are some tips on how to use the reports effectively.
Learn the persona of your target market
The Affinity Categories and In-Market Segments reports can give you an idea of what your target market looks like.
You can then use this information to tailor your marketing strategy to the right audience. Look to see if there are any patterns or similarities in the audiences.
For example, suppose you see that most of your website visitors and converters are pet lovers. In that case, you may decide to incorporate animals into your Display advertising or on your social networks.
Identify what Affinity Categories to target within your Search campaigns on Google Ads
Google Ads allows you to layer Affinity audiences on top of your search campaigns. You have two options when layering Affinity categories on top of your Search campaigns.
The first is to only show your ads to people who have searched for your keyword and also fall into the Affinity Category that you target.
The second option is to show your ads to everyone who searches for one of your keywords but to bid differently on those who also fall into one of your targeted Affinity Categories.
Look at the conversion rate and volume of each Affinity Category within Google Analytics. If you find that there is an Affinity Category that has a lot of volume and has a much better than average conversion rate, then you can choose to add this audience into your Search campaigns and bid higher on them.
You can afford to apply a bid modifier increasing bids on these audience lists because they have a much higher than average conversion rate.
Identify Affinity Categories and In-Market Segments to target on the Google Display Network
If there are any Affinity Categories or In-Market Segments that have a very high conversion rate, then this could be a sign that your best customers fall into that persona.
Targeting these audiences on Google’s Display Network could be a good way to expand your reach further and increase your sales.
You may need to further tighten the targeting of your Display campaign by layering additional keywords, topics, or exclusions on top of your audience. However, you already know that this audience list performs well on your website, so it is worth testing it on the Google Display Network.
Identify Affinity Categories to block from your Search campaigns
In addition to finding strong performing audiences, you may also find that certain audiences perform very poorly on your site.
In this case, you could block out the Affinity category by adding it as a negative audience within Google Ads.
This will mean that if anyone searches for one of your targeted keywords but falls into your poor performing Affinity audience, then Google will not show your ad. This can be a good way to trim the fat in your account and bring cost per conversion.
2. Time lag and path length reports
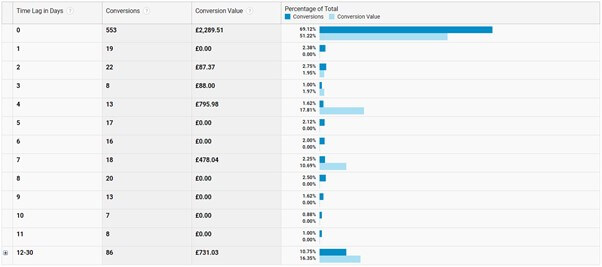
The Time lag report shows the number of days that pass before a conversion takes place. By default, it contains the conversions, conversion value and percentage breakdown.
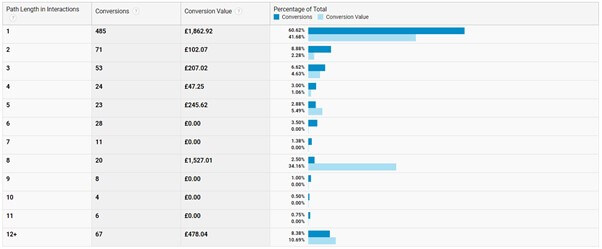
The Path Length report shows the number of times the user interacted with your site before they completed a conversion action. Similar to the Time Lag report, the Path Length report includes the Conversions, Conversion Value and Percentage of Total columns by default.
The Time Lag and Path Length reports can be combined to get an idea of how long the research phase is within your niche.
Where to find it
To find this, go to Conversions > Multi-channel Funnels > Time Lag or Path Length.
Columns in the report
Columns you can expect to see in the report are as follows:
- Conversions
- Conversion Value
- Percentage of Total
How to use the report
Below are some ways to use the report to benefit your PPC campaign.
Identify how many days you should wait before seeing the full impact of an advertising campaign
If you are running PPC advertising on products or services that have a long research phase, then in the first instance, your marketing efforts may appear to be performing poorly.
However, due to having a long research phase, you would expect to see a delay in the fruits of your advertising efforts.
The Time lag report helps you to work out how long you should expect to wait before you see the full effect of your PPC advertising campaign.
For example, suppose the Time Lag report shows that the majority of people convert five days after being exposed to your website. In that case, you know that you should expect more conversions to come through after the first four days of running your PPC marketing efforts.
Help with choosing the right attribution model
PPC advertisers really shouldn’t be using the last-click attribution model any-more. In short, it gives all the credit to the last click within a sales journey and ignores all the clicks that helped nurture the sale.
If you’re trying to decide which attribution model would be the best for your business, then the Time Lag and Path Length reports can help.
The Time Lag and Path length reports show how much of a considered purchase your product or service is. If you realise that the research phase before a conversion occurs isn’t very long, then you may decide to use the Time Decay attribution model.
This is because whilst it gives sharing out the credit between all the tracked clicks, it still gives the most credit to the last click.
If you find that the research phase is quite long, then you could choose an attribution model that is going to give a little less credit to the last click than the Time Decay attribution model.
3. Source/Medium report
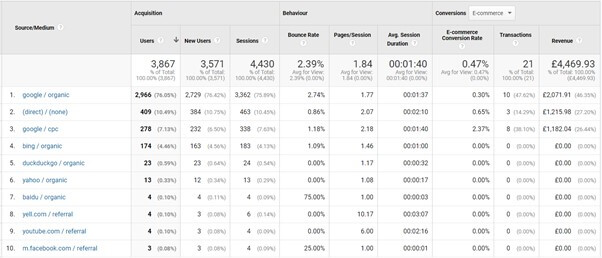
An incredibly useful report and a good place for those new to Google Analytics to start. The Source/Medium report gives a top-level view of how each of your marketing channels is performing.
It combines the source and the medium of the specific channel and gives you information such as the number of users and goals that were secured by that channel. The source/Medium report can be incredibly useful for PPC experts.
By default, Google Analytics can recognise some sites and attribute them to the correct source/medium.
For example, any traffic coming from the organic listings on both Google and Bing will automatically be attributed to the source/medium of Google/organic and Bing/organic, respectively.
If you want the traffic from a certain site to come through a specific source/medium, then you will need to add some UTM tracking to the links within that site.
For example, to track Google My Business traffic separately you can add the following UTM tracking to the end of the URL within your Google My Business listing:
https://example.com/?utm_source=google&utm_medium=gmb
This will tell Google Analytics to attribute any traffic coming from your Google My Business listing to the source google and the medium gmb.
Where to find the report
Here is how to find the report:
Acquisition > All Traffic > Source/Medium
Columns in the report
Below are the columns you can expect to see in the report.
- Users
- New users
- Sessions
- Bounce rate
- Pages/Session
- session duration
- E-commerce
- Conversion rate
- Transactions
- Revenue
Example uses of the report
Here are some example uses of the report.
Compare the performance of each advertising platform
Look at the bounce rate, conversion rate, session duration and pages per session of each channel. This can help you to identify which marketing areas your customers are not resonating well with.
Once you have identified which marketing area is performing poorly, you can start looking at improving that marketing channel.
Compare what type of goals are completed by each advertising platform
Not all marketing channels are equal. You shouldn’t use all marketing channels to achieve the same goal.
Some marketing channels may be producing more upper-funnel traffic, whereas others may be producing lower funnel traffic.
Make sure you have all your key touchpoints tracked as a goal. This will help you to understand what kind of goals each marketing channel produces more of.
Determine which platform is bringing in the highest amount of new users
Remarketing to users who have already interacted with your site can be a very good way to nudge people interested in your product or service to complete a conversion goal finally.
However, to be able to remarket to people, you first need to be getting regular new users to your site. Otherwise, your Remarketing lists will eventually dry up.
Therefore, it is important to look at which marketing channels are bringing in new users. There may be a marketing channel that is not producing a lot of your conversion goals but is bringing in a lot of new users that other marketing channels are then able to take advantage of.
4. Assisted Conversions report
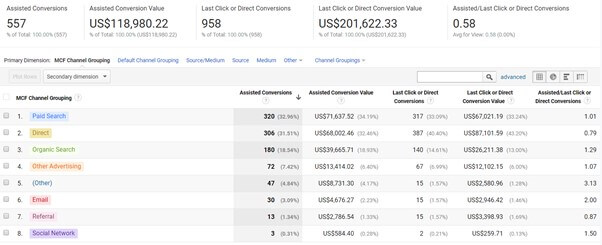
The Assisted conversions report shows the contribution of each channel in a concise way. It shows the number of last-click conversions and conversion value compared to all the conversions and conversion value where the channel wasn’t the last click.
It also gives the ratio of the of last-click conversions compared to assisted conversions. You can use this metric to calculate whether a channel is more of a research channel or a conversion channel.
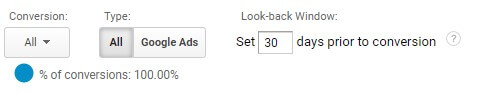
The assisted conversions report has some settings that you can use to tailor your analysis to the needs of your business. The Conversions drop-down list lets you choose which goals or transactions you want to include in the report.
The Type section allows you to either see the contributions made by each channel or the contributions made by each campaign within your Google Ads account.
Lastly, the Lookback window allows you to decide how far back Google Analytics should look when showing the click contribution of a channel or Google Ads campaign.
Where to find the report
Conversions > Multi-Channel Funnels > Assisted Conversions
Columns in the report
Assisted Conversions, Assisted Conversion Value, Last Click or Direct Conversions, Last Click or Direct Conversion Value, Assisted/Last Click or Direct Conversions
Primary Dimensions:
MCF Channel Grouping, Default Channel Grouping, Source/Medium, Source, Medium, Other
Example uses of the report
Here are some example uses of the report.
Determine where to invest more money and where to invest less money
You have the last click revenue and assisted revenue of each channel all in place. Once you’ve obtained the amount of money invested in each advertising channel, you can start to make decisions on which channel is performing the best and which one performs the worst.
You can then start to look at moving your budgets around to put more money into the more profitable channels and take the budget from the less profitable channels.
Find out which channels are upper funnel and which ones are lower funnel
The ‘Assisted/Last Click or Direct Conversions’ metric within the Assisted conversions report can help you to determine whether a particular paid channel is providing more upper-funnel traffic or more lower-funnel traffic.
It divides the number of assisted click conversions with the number of last-click conversions. This means that if the number outputted is less than one, the marketing channel is more of a lower-funnel channel that is more involved with directly converting your traffic.
If the number is higher than one, then that channel is more one that generates the interest that other channels then turn into conversions.
For example, you may find that your paid Facebook campaigns are bringing in more upper-funnel traffic, and your Google Ads campaigns are bringing in lower-funnel traffic.
Determine the full value of a Google Ads campaign
Selecting Google Ads from the Type section will show only Google Ads data segmented by the Google Ads campaign. You can compare the full value that a campaign is bringing into your business with the amount that it is spending.
You may find that some campaigns don’t appear to be profitable when looking at the Last click or direct conversion column. However, when you factor in the Assisted conversions, you may find that the campaign is returning a good level of return.
Similarly, you may find that even after you have factored in the Assisted conversions and the last click conversions, certain campaigns are not profitable. These are campaigns that you may want to pause.
5. Location report
The location report within Google Analytics can show how people are interacting with your website based on their location. A version of the location report does exist within the Google Ads platform, but it only gives you Google Ads data.
The data within Google Analytics is for everyone who has visited your website regardless of the channel that they came from.
We’re not going to talk about applying bid adjustments on locations that you’re targeting and excluding the poorest performing locations.
This is because you can already get the data to be able to do this within Google Ads. We’re going to focus on how you can use the Location data to carry out tasks that you wouldn’t be able to do in Google Ads.
Where to find the report
Audience > Geo > Location
Columns in the report
Users, New Users, Sessions, Bounce Rate, Pages/Session, Avg. Session Duration, Transactions, Revenue, E-commerce Conversion Rate
Example uses of the report
Identify high performing locations not yet being targeted
There may be certain locations that you had not thought about targeting with Google Ads. These locations won’t appear in your Google Ads reports because you’re not targeting them. There may be some gems that you had not thought about targeting.
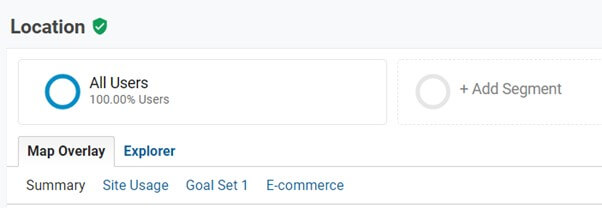
Start by filtering out data from your paid channels. One way to do this is to create a new segment that contains all traffic apart from Paid traffic.
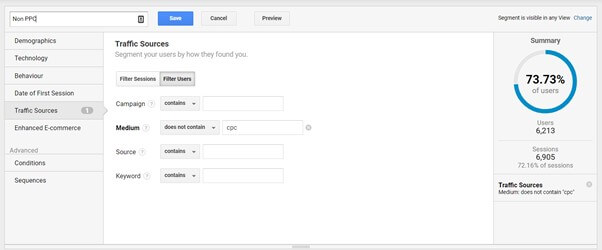
To do this, click on ‘Add Segment’ and then on ‘+New Segment’. From here you can choose the criteria for your new segment.
After giving your new segment a name, click on ‘Traffic Sources’, add ‘CPC in the ‘Medium’ column and select ‘does not contain’ in the drop-down menu.
This will create a segment that allows you only to see data where the medium is not CPC.
Look for cities and towns outside your targeted areas that have a high conversion rate. You may find that some locations perform well that you had not thought about targeting.
Carry out location analysis for a new PPC account
New advertisers without any PPC data can use the location data within Google Analytics to help them decide on the locations that they should target.
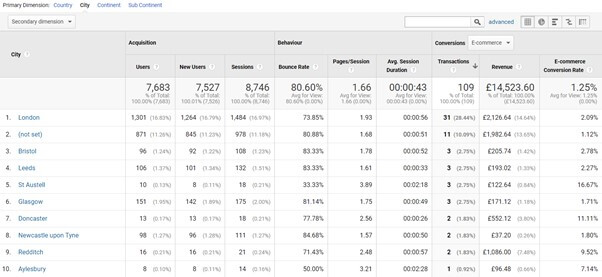
In the Location report, select ‘City’ as the Primary Dimension. This will show you your website’s performance data broken down city/town. You can use this data to see which areas perform well and which ones do not.
Once you have this data, you can decide on which locations to target with your PPC ads. Start by looking for the locations with the highest conversion rate. These are strong performing locations. If you are an eCommerce business, then make sure to note down your average order value as well.
This is because there may be certain locations that have a lower conversion rate but are still worth targeting because the average order value is high.
Another thing to note is the amount of traffic that you get from each location. If you have a very modest PPC budget, then you have the luxury of only going after your best performing locations.
If you have a larger budget, then you will need to keep an eye on the number of users being brought in by each location. You will need to make sure that you’re targeting enough locations to make use of your budget.
Find other countries to target
As a default, when you select the Location report, you will see the data broken down by country. If your PPC advertising efforts have proven to be very successful and you want to test expanding into a new country, then the location report will help you to decide which countries to target.
Look at the Countries with the highest conversion rate. These are the countries that appear to be performing quite well. You can consider targeting these countries with your PPC advertising.
Wrapping up
Even though Google Ads has a lot of very useful ways to segment and analyse your data, Google Analytics is an incredibly useful tool that should not be overlooked.
In this blog, we’ve discussed five Google Analytics reports that can help PPC marketers to make more informed decisions.
Whether you’re running paid search, Shopping, or Remarketing campaigns, make sure you sync up your Google Ads account with your Google Analytics account and start making use of the combined power Google Ads and Google Analytics.